A drama of GERD negotiations

I have collaborated with the  Geneva Water Hub and OuestWare to develop an interactive website to map out the controversy about the Grand Ethiopian Renaissance Dam (GERD), by investigating the debates that surrounded it at the UN Security Council.

See the website we created

The Controversial Lion

A short essay Anders Munk and I just published on the blog of the Society for the Social Study of Science (4s). It offers an amuse-bouche and a snappy introduction to our new Controversy Mapping field guide. It summarizes some of the key ideas of our book with an embellished metaphor, almost as a bed-time story.

Read it on the 4S Backchannels blog

Controversy Mapping. A Field Guide

Out in October, 2021 my book on controversy mapping authored with Anders Munk

Controversy Mapping is the first book to introduce readers to the observation and representation of contested issues on digital media. Drawing on actor-network theory and digital methods, Venturini and Munk outline the conceptual underpinnings and the many tools and techniques of controversy mapping. They review its history in science and technology studies, discuss its methodological potential, and unfold its political implications. Through a range of cases and examples, they demonstrate how to chart actors and issues using digital fieldwork and computational techniques. A preface by Richard Rogers and an interview with Bruno Latour are also included.

Take a peek at the table of contents

See the slides of the presentation

Going the extra mile of complexity

Controversy mapping and digital methods as tools for the management of innovation
Controversy mapping was introduced in ‘80s as a tool to teach STS to engineering students, who would have preferred to skip over the complexity of social dynamics. It was then used to teach science and technology to political science students keen to ignore the details of science and technology. As a research tool instantiated with digital methods, it became a way to make computational social sciences more reflexive and aware of their challenges. As a tool for public engagement, it contributes to open up discussions and amplify the diversity of viewpoints and arguments.
Such a track record of simplicity-spoiling suggests that controversy mapping and digital methods could also be helpful for companies and institutions interested in developing a richer and thicker understanding of innovation. To them, this approach offers a series of conceptual and practical tools to tackle the complexity of sociotechnical phenomena; to anticipate disagreements and conflicts; to consider the larger cast of human and non-human actors and a more varied catalogue of collective dynamics.

Download the slide of my presentation at ITU Copenhagen

We Only Have 12 Years: YouTube and the IPCC Report on Global Warming of 1.5C

This article contributes to the study of climate debates online by examining how the IPCC Special Report on Global Warming of 1.5°C (SR15) played out on YouTube following its release in October 2018. We examined features of 40 videos that ranked the highest in YouTube’s search engine over the course of four weeks after the publication of the report. Additionally, this study examines the shifting visibility of the videos, the nature of the channels that published them and the way in which they articulated the issue of climate change. We found that media activity around SR15 was animated by a mix of professional and user-led channels, with the former enjoying higher and more stable visibility in YouTube ranking. We identified four main recurrent themes: disaster and impacts, policy options and solutions, political and ideological struggles around climate change and contested science. The discussion of policy options and solutions was particularly prominent. Critiques of the SR15 report took different forms: as well as denialist videos which downplayed the severity of climate change, there were also several clips which criticized the report for underestimating the extent of warming or overestimating the feasibility of proposed policies.

Bounegru, Liliana, Kari De Pryck, Tommaso Venturini, and Michele Mauri. 2020. “We Only Have 12 Years: YouTube and the IPCC Report on Global Warming of 1.5C.” First Monday 25(2).

Read the paper online

Fake News – Call for collaboration

Pleased to announce a new project to create “A Field Guide to Fake News”, led by Liliana BounegruJonathan Gray and myself.

In the wake of concerns about the role of “fake news” in relation to the US elections, the project aims to catalyse collaborations between digital media researchers, data journalists and civil society groups. The guide will be the first project of the Public Data Lab – an interdisciplinary network seeking to facilitate research, democratic engagement and public debate around the future of the data society – in collaboration with the First Draft Coalition.

If you’re interested in collaborating to the project, refer to the Call for Collaborators.


From Analysis to Presentation

Boechat, Marina, and Tommaso Venturini. 2016. “From Analysis to Presentation: Information Visualization for Reifying Issues and Reenacting Insights in Visual Data Analysis.” Les Cahiers Du Numérique 4: 185–205. doi:10.3166/LCN.12.4.185-204.

In this paper, we discuss the use of information visualization in digital sociology, (particularly in Controversy Mapping), and its role in outlining issues and objects of study through progressive insights. We believe the differences in visualizations between analysis and presentation are better understood as linked by a chain of transformations, rather than as two separate and stable levels of representation. We propose that, through such chain, two research movements are performed: the reification of issues, related to the construction of a stable consensus, and the reenaction of insights, that points to the role of visualizations as communication tools. We will illustrate such movements and effects by using a few examples of visualizations produced in the EMAPS research project.

Read the preprint version of the paper

Data-Sprint: a Public Approach to Digital Research

Datasprint

Venturini, T., Munk, A., & Meunier, A. (2016). Data-Sprint: a Public Approach to Digital Research. (C. Lury, P. Clough, M. Michael, R. Fensham, S. Lammes, A. Last, & E. Uprichard, Eds.) Interdisciplinary Research Methods (forthcoming).

This paper is about the politics of transdisciplinarity. Not in the sense of the research politics fostering collaboration across disciplines, but in the stronger sense of transcending disciplinary boundaries to make significant political contributions. In short: it is about the making research public. Also, this chapter is not theoretical: it discusses the role of social sciences in collective life, but only to introduce (through a concrete example) an original transdisciplinary practice, that we call data-sprinting.

Read the pre-print version of the paper

EMAPS wins the Etoiles d’Europe prize

Happy to announce that the project EMAPS has won the prize Etoiles d’Europe celebrating the best EU financed research project.

See Climaps.eu the platform developed by EMAPS.

Read an interview about the prize.

Contropedia, and the question of analytically separating the medium and the message

ContropediaRoyalAcademy

My presentation of the Contropedia project at the Royal Netherlands Academy of Arts and Sciences, at the occasion of the award of the Erasmus prize to the Wikipedia Community

See the slides of the presentation

See the video of the lecture

A Tale of Two Cities: Controversy Mapping and Issue Mapping (and any subtle differences)

TwoCities
The presentation I gave at the Digital Methods Initiative Summer School for the launch of the book Issue Mapping for an Ageing Europe by Richard Rogers, Natalia Sanchez and Aleksandra Kil.

See the slides of the presentation

Designing Controversies and their Publics

DesigningControversies

Venturini, T., Ricci, D., Mauri, M., Kimbell, L., & Meunier, A. (2015). Designing Controversies and their Publics. Design Issues, 31(3)

Striving to make the intricacy of scientific debate readable for a larger public, controversy mapping is trapped in a classic simplicity/complexity trade-­off: how to respect the richness of controversies without designing maps too complicated to be useful? Having worked on the question for almost two years in a project bringing together social scientists and designers (emapsproject.com1), we can now propose a way out of this contradiction and suggest three ways of moving through the simplicity/complexity continuum.

Dowload the preprint

Watch a conference I gave on the topic at the University of Leuven

Societal Controversies in Wikipedia Articles

contropedia2

Borra, E., Weltevrede, E., Ciuccarelli, P., Kaltenbrunner, A., Laniado, D., Magni, G., … Venturini, T. (2015). Societal Controversies in Wikipedia Articles. In Proceedings of the 33rd Annual ACM Conference on Human Factors in Computing Systems – CHI ’15 (pp. 193–196). doi:10.1145/2702123.2702436

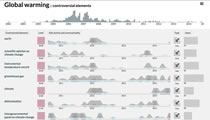
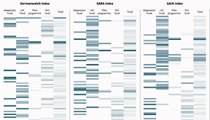
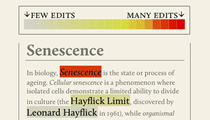
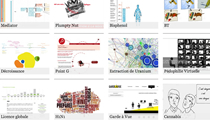
Collaborative content creation inevitably reaches situations where different points of view lead to conflict. We focus on Wikipedia, the free encyclopedia anyone may edit, where disputes about content in controversial articles often reflect larger societal debates. While Wikipedia has a public edit history and discussion section for every article, the substance of these sections is difficult to phantom for Wikipedia users interested in the development of an article and in locating which topics were most controversial. In this paper we present Contropedia, a tool that augments Wikipedia articles and gives insight into the development of controversial topics. Contropedia uses an efficient language agnostic measure based on the edit history that focuses on wiki links to easily identify which topics within a Wikipedia article have been most controversial and when.

Read the paper

Understanding Climate Negotiations Controversies

Negotiations

A introduction to the twists and turns of the climate negotiations and to the datasets that can be used to cover them that I gave to a little crowd of data-journalists from several French news outlets.

See the website of the event

See the presentations of the project developed by the participants

Climaps at Europeana 2015

europeana

The presentation I gave of EMAPS and its online-atlas Climaps.eu at at Europeana 2015 (one of the largest tech conference in Digital Humanities).

See the slides of the presentation

Politiques de la Terre – Politics of the Earth

PolitiquesDeLaTerre

Since the industrial revolution, the Earth may have entered the Anthropocene, a new geological epoch in which humans would be the main actors of the planet changes.  The term Anthropocene indicates a new phase in relations between a planet governed by physical and biological laws – the Earth system – and a set of human societies engaged in conflicting relations of domination governed by economic, social or political laws – the World system. But as this transformation requires rethinking the scales and the dynamics of collective action, it imposes rethink jointly the World and the Earth. Such is the general objective of the “Politics of the Earth” interdisciplinary program.

See the project website

Three Maps and Three Misunderstandings : A Digital Mapping of Climate Diplomacy

MappingClimateNegotiations

Venturini, T., Baya-laffite, N., Cointet, J., Gray, I., Zabban, V., & De Pryck, K. (2014). Three Maps and Three Misunderstandings : A Digital Mapping of Climate Diplomacy. Big Data & Society, 1:1

This article proposes an original analysis of the international debate on climate change through the use of digital methods. Its originality is twofold. First, it examines a corpus of reports covering 18 years of international climate negotiations, a dataset never explored before through digital techniques. Second, in this paper we test an original approach to text analysis that combines automatic extractions and manual selection of the key issue-terms. The originality of our corpus and of our approach encouraged us to question some of the habits of digital research and confront three common misunderstandings about digital methods.

Download the full text 
Read the article online
See the images at hi-resolution

Ocean Fertilisation Controversy

OceanFertilisation

The best controversy atlas in my 2013/14 Controversy Mapping course. It presents the debate around Ocean Iron Fertilisation as a citizen conference:

See the atlas

The ‘recovered memories’ controversy

FalseMemories

One of the best video of my students in the Controversy Mapping Course in 2014 (in French however).

Watch the video

The nk603 maize controversy

MaisSeralini

One of the best video of my students in the Controversy Mapping Course in 2014 (in French however).

Watch the video

Climaps by EMAPS, A Global Issue Atlas of Climate Change Adaptation

Climaps

Climaps.eu presents the results of the EU research project EMAPS, as well as its process: an experiment to use computation and visualization to harness the increasing availability of digital data and mobilize it for public debate. To do so, EMAPS gathered a team of social and data scientists, climate experts and information designers. It also reached out beyond the walls of Academia and engaged with the actors of the climate debate.

Climaps.eu is an online atlas providing data, visualizations and commentaries about climate adaptation debate. It contains 33 issue-maps and 5 issue-stories guiding the users in the combined reading of several maps. The atlas is addressed to climate experts (negotiators, NGOs and companies concerned by global warming, journalists…) and to citizens willing to engage with the issues of climate adaptation. It employs advanced digital methods to deploy the complexity of the issues related to climate adaptation and information design to make this complexity legible.

See the Climaps Online Atlas

See the Summary for Policy Maker of the Project on the Social Sciences Research Network

Cartografia de Controversias

Controversias

A week-long intensive course in controversy mapping that I gave at the Medialab of the Universitade Federale de Rio de Janeiro

See the video of the introductory conference

Contropedia (Controversy Mapping in Wikipedia)

Contropedia

Funded by the Network of Excellence in Internet Science (EINS) in the call “Disruptive ideas for an Internet Science”, Contropedia aims to build a platform for the real-time analysis and visualization of controversies in Wikipedia. Controversy metrics will be extracted from the activity streams generated by edits to, and discussions about, individual articles and groups of related articles.
In this project, I coordinate the médialab team and provide advice on the rational of controversy mapping.

See the project website

Watch a video presenting Contropedia

Controversy Mapping Syllabus

Crash

The syllabus of the two controversy mapping course I will teach at Sciences Po

PSIA (Paris School of International Affairs)

SCUBE (double licence en sciences et sciences sociales)

FORCCAST

forccast

The FORCCAST (Formation à la Cartographie des Controverses pour l’Analise de Sciences et de Techniques) project is meant to develop and disseminate the teaching method of controversy mapping. The project has received a 8 years funding by the French Government and gathers a growing consortium of national and international universities.

In the project FORCCAST, I am responsible for the coordination of the Axis 1, on the exploration of techno-scientific controversies.

See the project website

Designing Controversies for the Public

DesigningControversies

A conference on how to engage the publics of sociotechnical controversies in the effort of controversy mapping.

I have been invited to give this conference at the 2012 4S conference on Science and Technology Studies (Copenhague – 18/10/12), at the ‘Tactics of Issue Mapping’ seminar of Goldsmith University (London – 26/10/12), at the Department of Media Studies of the University of Amsterdam (17/04/13) and at the Ecsite Conference on science centres and museums (Gothenburg – 08/06/13).

See the slides of the conference

Controversy Mapping

ControversyArchive

Among other things, at Sciences Po I am responsible for coordinating and teaching the courses of Controversy Mapping. Controversy Mapping has been invented by Bruno Latour some twenty years ago as as a method to train students in the observation and description of sociotechnical debates. Since then, the method has evolved considerably and has been implemented by several universities all around the World (Paris, Copenhagen, Milan, Manchester, Amsterdam, Liège, Lausanne, Padova, Trento, Buenos Aires…).

See the archive of the best work of the students of the course

Communicating Controversies

CommunicatingControversies

Together with A. Lorenzet, I have organize a session on “Debating Environmental Controversies” at the Public Communication of Science and Technology Conference in Florence (18-20/04/12). In this session I gave a conference on the different types of communication of controversial issues.

Each controversy is a word apart and its specificity deserves an ad hoc communication strategy. A few ‘controversies families’ can however be identified. In this presentation I present three different types of controversies and their correspondent communication approaches. To do so, I draw on the climate change controversies showing how they clusters around three questions generating three different types of controversies: is global warming occurring and are we responsible? How do we mitigate global warming effects? How do we adapt to global warming?

See the slides of the conference

Follow the White Rabbit

FollowTheWhiteRabbit

An introductory controversy linking together controversy mapping and digital methods and explaining why the work well together.

This conference has been given at the Sociology Department of the Copenhagen University (04/03/12)

See the slides of the conference

Second Degree Objectivity

SecondDegreeObjectivity

One of the most intriguing notions developed by Bruno Latour as a part of his ‘controversy mapping’ approach is the idea of second-degree objectivity. ‘Second-degree objectivity’ is an objectivity obtained by the multiplication of different viewpoints; an objectivity that comes from diversity rather than from uniformity; an impartiality that comes from exploring a multitude of partial bias, rather than abstracting from them.

I have been invited to give this conference at the Visualizing Knowledge Controversies Symposium at the University of Oxford (21/01/12) and at the Social Sciences and Web2 workshop at La Cantine (Paris, 04/04/12).

See the slides of the conference

MEDEA (Mapping Environmental Debates on Adaptation)


To contribute to understanding the challenges raised by climate change and complement the EMAPS project, MEDEA  is meant develop an online toolkit to map the environmental debate in France. Financed by the Agence Nationale de la Recherche (CEP&S call), MEDEA starts under my coordination on November 1st 2011.

Download the project
See the project website

EMAPS (Electronic Maps to Assist Public Science)

picture of a melting glacier
What difference does it makes to be equipped with online tools for mapping technoscientific issues? Can such equipment improve the way we publicly discuss science and technology?

To answer such questions, Bruno Latour and I submitted EMAPS to the EU ‘Science in Society’ call.  Focusing on the web as a tool of collective endeavor, EMAPS aims at engaging the actors involved in climate adaptation debate in an ‘open-air’ experiment on the interactive platform developed within the project. Funded by the European Union Commission, the project starts on November first 2011.

Click here to download the project
See the project website

Diving in Magma: How to Explore Controversies with Actor-Network Theory

Venturini, T. (2010). Diving in magma: how to explore controversies with actor-network theory. Public Understanding of Science, 19(3), 258–273. doi:10.1177/0963662509102694

The cartography of controversies is a set of techniques to explore and visualize issues. It was developed by Bruno Latour as a didactic version of Actor- Network Theory to train college students in the investigation of contemporary socio-technical debate. The scope and interest of such cartography, however, exceed its didactic origin. Adopted and developed in several universities in Europe and the US, the cartography of controversies is today a full research method, though, unfortunately, not a much documented one. To fill this lack of documentation, we draw on our experience as Latour’s teaching assistant, to introduce some of the main techniques of the social cartographer toolkit. In particular, in these pages we will focus on exploration, leaving the discussion of visualization tools to a further paper.

Click here to download the preprint.

Building on Faults: How to Represent Controversies with Digital Methods

sismograph

Venturini, T. (2012). Building on faults: how to represent controversies with digital methods. Public Understanding of Science, 21(7), 796 – 812. doi:10.1177/0963662510387558.

In this article, I will discuss how to render the complexity of controversiesvthrough an original visualization device: the controversy- website. Capitalizing on the potential of digital technologies, the controversy-website has been developed as a multilayered toolkit to trace and aggregate information on public debates.

Click here to download the preprint.

Degrowth Controversy


One of the best websites realized in 2011 by the students of my Controversy Mapping course.

Click here to see the website.

Global Licence Controversy


One of the best websites realized in 2011 by the students of my Controversy Mapping course.

Click here to see the website.

MACOSPOL

macospol

My adventure in controversy mapping and my collaboration with Bruno Latour started with the MACOSPOL (MApping COntroversies On Science for POLitics) project, where I worked as an advisor to the Paris team.

See the web-platform delivered by the project

Piccola introduzione alla cartografia della controversie

controversies

Venturini, T. (2008). Piccola introduzione alla cartografia delle controversie. Etnografia e ricerca qualitativa, 3, 369–394.

The cartography of controversies (cartografia delle controversies) is a collection of techniques to observe and describe social issues developed by Bruno Latour as an applied version of Actor-Network Theory. Originally, it was used to guide college students in the exploration of scientific and technological debates. The scope and interest of such cartography, however, exceed its didactic origin. Adopted in several universities and developed by a number of international projects, the cartography of controversies is today a full research methodology. In this article, we draw on our experience as Latour’s teaching assistant, to introduce some of the main ideas and techniques of the cartography of controversies.

Download the preprint (in Italian)

Les trous noirs de la Révolution Verte

GreenRevolution

Venturini, T. (2007). Les trous noirs de la Réevolution Verte. Décroissance & technique, 3.

This article describes the controversies stirred by the process of agricultural modernization in the so-called ‘green-revolution’

Download the preprint (in French)

Seminare Vento

SeminareVento

PhD research on the sociology of modernization at the University of Milano Bicocca.

The research investigates the tensions connected to the modernization of agriculture by analyzing a series of controversy on biopiracy and the patenting of agro-biodiversity.

Download the research report