UnMISSeD project

Funded by the European Media and Information Fund of the Gulbenkian Foundation, UnMiSSeD investigates the interaction between science and misinformation. Through a quali-quantitative approach, we examine questions such as: Does scientific information establish a common evidence base for societal debate? Does scientific information lead to convergence or to divergence of opinions? We combine the investigation of a large dataset of tweets around COVID-19 with a “close reading” of how these discussions permeate the porous boundaries of social media.

Read the project presentation

Quali-Quantitative (or non-binary) Methods

Venturini, T. (2024). “Quali-Quantitative (or non-binary) Methods”. In A. Irwin & U. Felt (Eds.), Encyclopedia of Science and Technology Studies (forthcoming).

In this entry for the Encyclopedia of Science and Technology Studies, I discuss quali-quantitative methods as research techniques do not comply with the norms and expectations of both qualitative and quantitative research. This definition is deliberately vague and emphatically negative. Indeed, a more precise name for these techniques would be “neither-quali-nor-quantitative methods” or “non-binary methods” since this approach is less interested in combining the best of the qualitative and quantitative world than in breaking free from the constraints of both.

Read the pre-print version

Digital Methods (master course)

The course introduces its students to a palette of social research methods based on the repurposing of a variety of data, tools and computational techniques unique to the modern web and freely available online. The panorama of digital methods being too vast and rich to be taught in a single course, this teaching aims at breadth rather than depth. It deliberately browses through a multiplicity of tools and approaches, but does not delve into any of them. It does, however, provide students with the conceptual and technical foundations necessary to independently explore the details of the methods that are most interesting to them.

See the course page at the University of Geneva

Read the syllabus of the course

Staying with the trouble of networks

van Geenen, D., Gray, J. W. Y., Bounegru, L., Venturini, T., Jacomy, M., & Meunier, A. (2023). Staying with the trouble of networks. Frontiers in Big Data, 5.

In this article, we explore how problems with network practices highlight the diverse settings and situations in which network graphs and maps are created and used in society. In doing so, we draw on cases from our research, engagement and teaching activities involving making networks, making sense of networks, making networks public, and making network tools.

Read the paper in Frontiers in Big Data (open access)

A drama of GERD negotiations

I have collaborated with the  Geneva Water Hub and OuestWare to develop an interactive website to map out the controversy about the Grand Ethiopian Renaissance Dam (GERD), by investigating the debates that surrounded it at the UN Security Council.

See the website we created

CultureIA project

Funded by the French National Research Agency (ANR), CulturIA aims to provide a cultural approach to AI, combining methods from the history of science, the history of science, the history of ideas and collective imaginaries with field analyzes. The research hypothesis of the project is the need to understand AI not only as a set of algorithms, but also as a “technoculture” where sciences are inscribed in institutions, but also in situated cultural contexts and in imaginaries involving ideologies, fictions, sensitive representations.

See the website project

ScientIA projet

Funded by the French National Research Agency (ANR), ScientIA aims to analyze, with a comparative perspective, the impacts of the introduction of AI in academic and industrial research. The project is based on an interdisciplinary framework combining computational tools (network science, complex systems methods, AI techniques, modeling, etc.) and social science methods (qualitative interviews and surveys).

See a first set of maps created for the project

Memecry: Tracing the Repetition-with-Variation of Formulas on 4chan/pol/

Hagen, S., & Venturini, T. (2023). Memecry: Tracing the Repetition-with-Variation of Formulas on 4chan/pol/. Social Science Research Network, 1–31.

In this paper, we introduce the notion of ‘memecry’ to conceptualise the dynamics of repetition-with-variation of Internet memes. We propose a large-scale operationalisation using 341 million posts made since 2014 on /pol/, the far-right politics subforum of the imageboard 4chan. We draw from literature on primary and secondary orality to relate memecry to the dynamics of online subcultures and to operationalise its study through formulas: mnemonic phrases encapsulating important elements of oral cultures, which have arguably regained prominence in ephemeral online environments like 4chan.

Read the paper in the Social Science Research Network (open access)

“A Difficult Crossing” Invited Speech at the French Complex Systems Conference

The collaboration between complex systems and social sciences can bring about a real revolution in the study of collective phenomena. But it is not the one we imagine. Dazzled by the muscles of big data and computational techniques, we often forget that the true value of interdisciplinarity lies elsewhere. The revolution of digital methods is not a question of “more” (more data, more calculation, more quantification…), but a question of “new”. It lies in the ability to generate new traces, new analytical combinations, new exploration and visualization tools. For too long, social inquiry has been bogged down in the quali/quanti opposition which, despite its historical rationale, has ended up anesthetizing our methodological imagination. The encounter with complex systems can wake us up.

Download the slides of my presentation

Computation as a quali-quantitative method. Investigating IPCC Leadership


A presentation I gave at the Centre for Data Culture and Society at Edinburgh, discussing how to use advanced computational techniques of as quali-quantitative methods to investigate the organisational elite of the Intergovernmental Panel on Climate Change.

Download the slides of my presentation

See the recording of the seminar

Controversy Mapping. A Field Guide

Out in October, 2021 my book on controversy mapping authored with Anders Munk

Controversy Mapping is the first book to introduce readers to the observation and representation of contested issues on digital media. Drawing on actor-network theory and digital methods, Venturini and Munk outline the conceptual underpinnings and the many tools and techniques of controversy mapping. They review its history in science and technology studies, discuss its methodological potential, and unfold its political implications. Through a range of cases and examples, they demonstrate how to chart actors and issues using digital fieldwork and computational techniques. A preface by Richard Rogers and an interview with Bruno Latour are also included.

Take a peek at the table of contents

See the slides of the presentation

A collaborative path to scientific discovery

A collaborative path to scientific discovery: Distribution of labor, productivity and innovation in collaborative science Floriana Gargiulo, Maria Castaldo , Tommaso Venturini, and Paolo Frasca

In this work we dig into the process of scientific discovery by looking at a yet unexploited source of information: Polymath projects. Polymath projects are an original attempt to collectively solve mathematical problems in an online collaborative environment. To investigate the Polymath experiment, we analyze all the posts related to the projects that arrived to a peer reviewed publication with a particular attention to the organization of labor and the innovations originating from the author contributions. We observe that a significant presence of sporadic contributor boosts the productivity of the most active users and that productivity, in terms of number of posts, grows super-linearly with the number of contributors. When it comes to innovation in large scale collaborations, there is no exact rule determining, a priori, who the main innovators will be. Sometimes, serendipitous interactions by sporadic contributors can have a large impact on the discovery process and a single post by an occasional participant can steer the work into a new direction.

Read the preprint on Arxiv

Introducing Bibliograph

Developed with the support of the Mission pour les initiatives transverses et interdisciplinaires du CNRS, Bibliograph allows you turn a corpus of scientometrics records from ISI Web of Science or Scopus into a landscape of bibliographic coupling. Such a landscape consists in:

1. A base map network of references co-occurring in the records of the corpus – weighted by the frequency of their co-occurrence;

2. A layer of metadata extracted from the records (e.g. authors, subject areas, keywords) and positioned in the graph according to their co-occurrence with the references of the base map.

Try out the tool

Access to the open-source code

See the slides of a presentation of the tool


Going the extra mile of complexity

Controversy mapping and digital methods as tools for the management of innovation
Controversy mapping was introduced in ‘80s as a tool to teach STS to engineering students, who would have preferred to skip over the complexity of social dynamics. It was then used to teach science and technology to political science students keen to ignore the details of science and technology. As a research tool instantiated with digital methods, it became a way to make computational social sciences more reflexive and aware of their challenges. As a tool for public engagement, it contributes to open up discussions and amplify the diversity of viewpoints and arguments.
Such a track record of simplicity-spoiling suggests that controversy mapping and digital methods could also be helpful for companies and institutions interested in developing a richer and thicker understanding of innovation. To them, this approach offers a series of conceptual and practical tools to tackle the complexity of sociotechnical phenomena; to anticipate disagreements and conflicts; to consider the larger cast of human and non-human actors and a more varied catalogue of collective dynamics.

Download the slide of my presentation at ITU Copenhagen

On Biting Off More than You can Chew

The presentation I give at the Copenhagen Center for Social Data Science (SODAS) in their series of Social Data Discussions and Lecture Series: Mixed Methods.

Digital methods have been advertised by several scholars (including myself) for their potential to get over the divide between qualitative and quantitative methods. This crossing, however, has never been easy and quali-quantitative researchers has developed different strategies to tackle this difficulty. Some decided to “go native” and skillfully attuned their research questions to the methodological affordances of the available digital records. Other have preferred to “go meta” and investigate the limits and bias of digital research. These strategies are indubitably judicious, yet they give up (perhaps rightfully, perhaps a bit too quickly) a more ambitious goal of digital social sciences: exploring the deep cultural consequences of large sociotechnical systems. This requires crossing the quali-quantitative gap at its widest, stretching computational approaches over thick anthropological questions. Is this ambitious or just crazy?

In my in talk I will address this questions by presenting an ongoing research on digital folklore, attention cycles and platforms infrastructure.

Dowload the slides of my presentation


Similarity Sampling by Machine Learning

A Social Science Experiment with Artificial Intelligence and IPCC Leadership
By Tommaso Venturini, Tobias Blanke and Kari De Pryck

In this paper we devise a machine learning protocol to tackle a complex sociological task: extending a sample of organisational leaders starting from a list of individuals nominated for the Bureau of the Intergovernmental Panel on Climate Change (IPCC). The difficulty in this task lies in the impossibility to spell out explicitly the characteristics that define leadership in a complex, highly distributed and political organisation. To bypass this lack of explicit definition, we use a series of techniques for anomaly detection to identify, among IPCC contributors, those with profiles similar to the official Bureau nominees. We found that we can build a model capable of a surprisingly accurate reading of IPCC leadership despite the social and political complexity of this organisation, and that we can usefully use that model to extend our initial sample.

Read the preprint

Bridging in Network Organisations the Case of International Panel on Climate Change

Bridging in Network Organisations the Case of International Panel on Climate Change
by Tommaso Venturini, Kari De Pryck and Robert Ackland

In this paper, we investigated the relational architecture of the Intergovernmental Panel on Climate Change focussing on the individuals that, in the thirty years of existence of the IPCC, have assured the connection between the different temporal, thematic and functional divisions of the organisation. To identify these bridge individuals, we proposed a new measure of bipartite bridgeness defined as the summation of the inverse Jaccard similarity coefficient of the neighbourhoods of all pairs of divisions to which an individual has participated. As we illustrated using an original database of the eight thousand individuals who contributed to the IPCC since its foundation, this measure of bipartite bridgeness is more informative than the simple degree, as it takes into account the importance and the rareness of the connections assured by each bridge.

Read the preprint

Indicating interdisciplinarity in AI

I recently give a talk discussing the experience of creating and presenting the “atlas of artificial intelligence’s matters of reflection” at the Global Forum for Artificial Intelligence for Humanity

See the slides of my presentation

We Only Have 12 Years: YouTube and the IPCC Report on Global Warming of 1.5C

This article contributes to the study of climate debates online by examining how the IPCC Special Report on Global Warming of 1.5°C (SR15) played out on YouTube following its release in October 2018. We examined features of 40 videos that ranked the highest in YouTube’s search engine over the course of four weeks after the publication of the report. Additionally, this study examines the shifting visibility of the videos, the nature of the channels that published them and the way in which they articulated the issue of climate change. We found that media activity around SR15 was animated by a mix of professional and user-led channels, with the former enjoying higher and more stable visibility in YouTube ranking. We identified four main recurrent themes: disaster and impacts, policy options and solutions, political and ideological struggles around climate change and contested science. The discussion of policy options and solutions was particularly prominent. Critiques of the SR15 report took different forms: as well as denialist videos which downplayed the severity of climate change, there were also several clips which criticized the report for underestimating the extent of warming or overestimating the feasibility of proposed policies.

Bounegru, Liliana, Kari De Pryck, Tommaso Venturini, and Michele Mauri. 2020. “We Only Have 12 Years: YouTube and the IPCC Report on Global Warming of 1.5C.” First Monday 25(2).

Read the paper online

Visual Network Analysis at Lisbon iNOVA Smart Data Sprint

In my keynote at the iNOVA Smart Data Sprint, I discussed the conceptual basis of Visual Network Analysis. I started by reviewing the emerging standards of VNA and explain their conceptual and historical basis. I provided practical advice on how to read graphs and make them more legible. I discussed, more conceptually, the kind of information delivered by VNA and its specific way of dealing with ambiguity. I conclude by sketching a formal analysis of the limits of network visualization.

Download the slides of the keynoteDownload the slides of my presentation

Machine learning as a quali-quantitative method: investigating the composition of the IPCC Bureau

A presentation I gave at the University of Hamburg on a new research project (with Kari De Pryck and Tobias Blanke), which aims at repurposing advanced techniques of machine learning and artificial intelligence as a quali-quantitative method to investigate organisational elites
and in particular the Bureau of the Intergovernmental Panel on Climate Change.

Download the slides of the presentation


What do we see when we look at networks

It is an increasingly common practice in several natural and social sciences to rely on network visualisations both as heuristic tools to get a first overview of relational datasets and as a way to offer an illustration of network analysis findings. Such practice has been around long enough to prove that scholars find it useful to project networks on a space and to observe their visual appearance as a proxy for their topological features. Yet this practice remains largely based on intuition and no investigation has been carried out on to render explicit the foundations and limits of this type of exploration. This paper provides such analysis, by conceptually and mathematically deconstructing the functioning of force-directed layouts and by providing a step-by-step guidance on how to make networks readable and interpret their visual features.

What do we see when we look at networks an introduction to visual network analysis and force-directed layouts. Tommaso Venturini, Mathieu Jacomy, Pablo Jensen

Read the paper in Arxiv

VOSON Lab Fellow

During my visiting at the Australian National University in Canberra, I’ve been invited to join the VOSON Lab. An opportunity which of course I’ve gladly accepted!

The Virtual Observatory for the Study of Online Networks (VOSON) Lab is located in the Research School of Social Sciences at The Australian National University. We are advancing the Social Science of the Internet through an innovative program of research, research tool development, teaching & research training. We use various terms to describe what we do: web science, network science, computational social science, big data analytics, e-research. The VOSON Lab was formally established in 2005 with an Australian Research Council Special Research Initiative grant. We have been researching online networks since before the era of Facebook and Twitter, and our research has been funded by several ARC grants.

See the lab website

Writing with Data Workshop

This workshop, which I’ve taught at the University of Amsterdam and at the Australian National University, is meant to provide a collective and hands-on reflection on the techniques of academic writing, with a specific focus on writing for the social sciences. It is explicitly inspired by the “writing workshops” organised by Howard Becker in Chicago and Bruno Latour in Paris, but adapts such model to the writing of essays that are based on the analysis of data.

The workshop considers all types of writing (visual as well as textual) and explores their role not only in the presentation of findings but also in the staging of the research protocol. Writing with data is the art (or rather the artisanship) of crafting coherence between the conceptualisation, the operationalisation and the presentation of a scientific research.

Read the workshop’s presentation

Visiting at Australia National University

From January to March 2019, I have been visiting research at the School of Sociology at the Australian National University in Canberra, thanks to a scholarship of the College of Arts & Social Sciences.

During my visit I have organised three sessions of my “Writing with Data Workshop” and I have worked with professors Robert Ackland and Adrian Mackenzie. Together, we organised a data sprint on online attention dynamics, where we concentrated in particular on data extracted from Reddit.

Download the slides of the introductory presentation and of the results of my group

“API-based research” or how can digital sociology and digital journalism studies learn from the Cambridge Analytica affair

This paper draws on the Cambridge Analytica scandal to discuss the future of API-based research and the importance to develop more solid and diverse digital fieldwork practice.

API-based research is an approach to computational social sciences and digital sociology based on the extraction of records from the datasets made available by online platforms through their application programming interfaces (or APIs). This type of research has allowed the collection of detailed information on large populations, thereby effectively challenging the distinction between qualitative and quantitative methods. Lately, access to this source of data has been significantly reduced after a series of scandals connected to the use of personal information collected through online platforms. The closure of APIs, however, can have positive effects, if it encourages researchers to reduce their dependence on mainstream platforms and explore new sources and ways to collect records on online interactions that are closer to the digital fieldwork.

Venturini, Tommaso, and Richard Rogers. 2019. “‘API-Based Research’ or How Can Digital Sociology and Digital Journalism Studies Learn from the Cambridge Analytica Affair.” Digital Journalism, Forthcoming.

Download the preprint

The Jazz Network

For an upcoming article that I am preparing on Visual Network Analysis with Mathieu Jacomy and Pablo Jensen, I’ve created a testbed network of the actors of the jazz scene.

Download the zipped .gexf of the network

Read how it has been generated and analysed

Ator-rede versus Análise de Redes versus Redes Digitais: falamos das mesmas redes?

Venturini, Tommaso, Anders Munk, Mathieu Jacomy, Tommaso Venturini, Anders Munk, and Mathieu Jacomy. 2018. “Ator-Rede versus Análise de Redes versus Redes Digitais: Falamos Das Mesmas Redes?” Galáxia (São Paulo), no. 38: 5–27. doi:10.1590/1982-2554236645.

The Portuguese translation of my paper “Actor-Network VS Network Analysis VS Digital Networks Are We Talking About the Same Networks?”

Read it online

Download the PDF

Teaching Infrastructures Breaching through Data journalism and Data Activism

Conference of the European Association of Studies of Science and Technology, 25-28 July, Lancaster UK

Far from being neutral, data generate political effects at every stage of their production, cleaning, analysis and presentation. Such effects are sometimes manifest, for example in the use of demographic statistics for the justification of public governance, and sometimes, subtler for example in the way we classify knowledge in our libraries.

While the bias of the data is easy to proclaim, it is more difficult to observe and even more to teach. Information systems hide their political attachments, not necessarily maliciously, but simply because such opacity makes them more efficient in their tasks of knowledge management. It would be impossible to search a piece of information on the Web if, every time, we had to discuss Google’s business model or to wonder why its algorithms privilege some results. Yet, data infrastructures have fundamentals political consequences that must be part of any curriculum related to digital technologies.

Data activism arises precisely from the desire to expose the power asymmetries inherent to information systems. It seeks to promote access to data; to investigate the conditions of their production; to explain the constraints they generate; to propose alternative ways of redistributing their social consequences. Precisely because it raises awareness about the political dimension of digital technologies, the practice of data activism can be beneficial to make students sensitive to the effects of the sociotechnical infrastructures.

In this contribution we discuss the benefits and the difficulties of teaching data activism and data journalism drawing on the experience of a course at ENS Lyon France and at King’s College London.

Download the slides of the presentation

Confessions of a Fake News Scholar

Tommaso Venturini (2018). Confession of a Fake News Scholar (or “on to study popular subject). 68th Annual Conference – International Communication Association, Prague, 24-28 May 2018

Should we talk about “fake news”? According to several observers, we shouldn’t as this notion is vague, politically dangerous; indistinguishable from past misinformation; charged with a simplistic idea of truth, and missing the most important feature of the phenomenon it defines. Such feature is not deceptiveness, but virality – the capacity to pollute media public debate by spreading and transforming. But if virality is the defining features of fake news, then isn’t their critique another way of propagating the infection? Yes and no. Yes, if we stop at the critique. No, if we exploit it to encourage a media inquiry. Because of its simplicity, exaggeration, diffusion, rapid reproduction and mutation, fake news may be the drosophila of media studies.

Download the full paper

Download the slides of my presentation

Japanese translation of the Field Guide to ‘Fake News’

The Public Data Lab and myself are delighted to see the Japanese translation of the Field Guide to ‘Fake News’ and Other Information Disorders”. Through its various recipes we hope to inspire investigations and experiments not only around misleading content, but also the platforms, infrastructures and algorithms through which they are shared, quantified, monetised and through which they gain their viral character. Recent events serve as a reminder that this remains a vital area for research, reporting, public debate and public policy – and we look forward to seeing how the guide is used in Japan.

Download the Field Guide in Japanese

A Reality Check(-list) for Digital Methods

Venturini, T., Bounegru, L., Gray, J., & Rogers, R. (2018). A reality check(list) for digital methods. New Media & Society, (forthcoming), doi.org/10.1177/1461444818769236

Digital Methods can be defined as the repurposing of the inscriptions generated by digital media for the study of collective phenomena. The strength of these methods comes from their capacity to take advantage of the data and computational capacities of online platforms; their weakness comes from the difficulty to separate the phenomena that they investigate from the features of the media in which they manifest (‘the medium is the message’, according to McLuhan’s 1964 dictum). In this article, we discuss various methodological difficulties deriving from the lack of separation between medium and message and propose eight practical precautions to deal with it.

Download the preprint

Read the article online

A Field Guide to Fake News

Today sees the launch of A Field Guide to “Fake News and Other Information Disorders, a new free and open access resource to help students, journalists and researchers investigate misleading content, memes, trolling and other phenomena associated with recent debates around “fake news”.

The field guide responds to an increasing demand for understanding the interplay between digital platforms, misleading information, propaganda and viral content practices, and their influence on politics and public life in democratic societies.

It contains methods and recipes for tracing trolling practices, the publics and modes of circulation of viral news and memes online, and the commercial underpinnings of this content. The guide aims to be an accessible learning resource for digitally-savvy students, journalists and researchers interested in this topic.

Download the field guide

Read an article presenting the project and its first results

Read an article using the methods of the guide on BuzzFeed News

Data Activism course @ ENS Lyon

This course I have taught, with Axel Meunier, at the Ecole Normale Supérieure of Lyon intends to train students in the politics of information through a data activism project – the actual intervention in a public debate through the mobilization of digital data and the collaboration with the actors engaged in this field

Far from being neutral, the data generate political effects at every stage of their production, cleaning, analysis and presentation. But while the bias of the data is easy to proclaim, it is more difficult to observe. Information systems hide their political attachments, not necessarily maliciously, but simply because this allows them to be more efficient in their tasks of knowledge and coordination. It would be impossible to search a page on the Web if we had to discuss every time the business model of Google or wonder why his algorithms privilege some results rather than others. Yet, data infrastructures have the fundamentals political consequences that digital scholars cannot ignore.

Data activism arises precisely from the desire to expose (and if possible re-balance) the power asymmetries inherent to information systems. It seeks to promote access to data; to investigate the conditions of their production; to explain the constraints they generate; propose alternative ways of redistributing their social consequences.

See the official website of the course

See the online log of our work

Doing Networks Other than with Mathematics

On the October 27th 2017, I was invited to give the keynote lecture for the Digital Humanities Day of the University of Groningen. Here is the abstract of my talk:

Networks are, no doubt, powerful mathematical objects. But there is more to networks then the properties of their adjacency matrix. Networks are also rich visual diagrams and engaging narrative devices. In this keynote, we will discuss these often-neglected properties and we will propose a few practical ways to explore network visually and to elicit the stories that they contain.

See the slides of my presentation

Public Data Lab

I am very proud to introduce the new research network I have recently co-founded with friends and colleagues from all over Europe:

The Public Data Lab (publicdatalab.org) is a network of European researchers working on digital data and public interventions. It seeks to facilitate research, engagement and debate around the future of the data society. We work in collaboration with researchers, practitioners, journalists, civil society groups, designers, developers and public institutions across the world. Our approach characterised by:

  • Intervention around social, political, economic and ecological issues;
  • Participation through involving different publics in the co-design of our work;
  • Artisanship in advancing the craft of developing data projects and experiences;
  • Openness in sharing our research, data and code for all to use.

See our website

Hors champs: la multipositionnalité par l’analyse des réseaux

Venturini, T., Jacomy, M., Baneyx, A., & Girard, P. (2016). Hors champs: la multipositionnalité par l’analyse des réseaux. Réseaux, 199(5), 11–42. http://doi.org/10.3917/res.199.0011

This article is based on a research by Luc Boltanski on professor of the Institut des Étude Politique of Paris. In this research, Boltanski relies on a table to represent different social fields and to show that the French elite and elites in general are characterized above all by its multipositionality – that is to say by the tendency of its members to occupy several positions in several fields. By replacing Boltanski’s table with a network of individuals and institutions, we will discuss the features and the benefits of a heterogeneous network sociology.

Download the preprint

Read the article online

The Fish Tank Complex of Social Modelling

Venturini, T. (2018). The Fish Tank Complex of Social Modelling. In M. Nagatsu & A. Ruzzene (Eds.), Frontiers of Social Science: A Philosophical Reflection. New York: Bloomsbury (forthcoming).

In the BBC documentary The Blue Planet, the British naturalist David Attenborough narrates marine life commenting on the ‘time-lapsed’ images of a tropical reef. The images are beautiful and surprising. Played at accelerated speed, the sequences reveal corals for what they are: not minerals or plants, but animals who grow, crawl, hunt and fight to survive. The effect is startling: the change of tempo shatters the relation between the action and its scenery. While the expected actors disappeared (as the fishes of the reef), the theater wings suddenly come alive and take the center of the stage. A similar effect, I hold, can be experienced in social phenomena by abandoning the spatial metaphors we traditionally use to understand them.

I refer here to the classic micro/macro distinction, which not only distinguish actors from structures, but also picture them as nested levels, with actors moving through structures as trains travelling through railways. To be sure, most social theories admit relations between the two levels. Yet, relation does not question separation and our imagination remains trapped in a sort of ‘fish tank complex’ – a conceptual framing where social actors moves against a static background, like fishes in a plastic aquarium.

Download the PDF of the article

Visual Network Exploration for Data Journalists

Venturini, T., Jacomy, M., Bounegru, L., & Gray, J. (2018). Visual Network Exploration for Data Journalists. In S. I. Eldridge & B. Franklin (Eds.), The Routledge Handbook to Developments in Digital Journalism Studies. Abingdon: Routledge. (forthcoming)

Networks are classic but under-acknowledged figures of journalistic storytelling.  Yet, journalists have so far made little use of the analytical resources offered by networks. To address this problem in this chapter we examine how “visual network exploration” may be brought to bear in the context of data journalism in order to explore, narrate and make sense of large and complex relational datasets. We borrow the more familiar vocabulary of geographical maps to show how key graphical variables such as position, size and hue can be used to interpret and characterise graph structures and properties. We illustrate this technique by taking as a starting point a recent example from journalism, namely a catalogue of French information sources compiled by Le Monde’s Decodex. We establish that good visual exploration of networks is an iterative process where practices to demarcate categories and territories are entangled and mutually constitutive.

Download the PDF of the article

An unexpected journey: A few lessons from sciences Po médialab’s experience

Venturini, T., Jacomy, M., Meunier, A., & Latour, B. (2017). An unexpected journey: A few lessons from sciences Po médialab’s experience. Big Data & Society, 4(2), 205395171772094. doi.org/10.1177/2053951717720949

In this article, we present a few lessons we have learnt during our experience at the Sciences Po médialab. These lessons concern three main aspects of the sociological work: the traces and data that we investigate; the methods with which we analyse them; and the social theory that we use to interpret our results. In all these aspects, the médialab journey brought us to overcome the oppositions that characterize social sciences (qualitative/quantitative, situation/aggregation, micro/macro, local/global) and to move in the direction of a more continuous sociology.

Download the PDF of the article
Read the article online at Big Data and Society

Fake News – Call for collaboration

Pleased to announce a new project to create “A Field Guide to Fake News”, led by Liliana BounegruJonathan Gray and myself.

In the wake of concerns about the role of “fake news” in relation to the US elections, the project aims to catalyse collaborations between digital media researchers, data journalists and civil society groups. The guide will be the first project of the Public Data Lab – an interdisciplinary network seeking to facilitate research, democratic engagement and public debate around the future of the data society – in collaboration with the First Draft Coalition.

If you’re interested in collaborating to the project, refer to the Call for Collaborators.


From Analysis to Presentation

Boechat, Marina, and Tommaso Venturini. 2016. “From Analysis to Presentation: Information Visualization for Reifying Issues and Reenacting Insights in Visual Data Analysis.” Les Cahiers Du Numérique 4: 185–205. doi:10.3166/LCN.12.4.185-204.

In this paper, we discuss the use of information visualization in digital sociology, (particularly in Controversy Mapping), and its role in outlining issues and objects of study through progressive insights. We believe the differences in visualizations between analysis and presentation are better understood as linked by a chain of transformations, rather than as two separate and stable levels of representation. We propose that, through such chain, two research movements are performed: the reification of issues, related to the construction of a stable consensus, and the reenaction of insights, that points to the role of visualizations as communication tools. We will illustrate such movements and effects by using a few examples of visualizations produced in the EMAPS research project.

Read the preprint version of the paper

A Data Journalism Hackathon at King’s College London

djsprint_small

On the 2nd of December, 2016, in collaboration with Open Knowledge International and the EU project SoBigData, the students of my Data Journalism Course (KCL Data Journalism Course) at King’s College, will have the chance to participate to a one-day hands-on data journalism workshop.

During the workshop, they will work with data experts, journalists and activists from various civil society organisations to collect, analyse and visualise data on international taxation (taxjustice.net); clinical trials (opentrials.net); human rights violations (decoders.amnesty.org); natural resources extraction (resourcegovernance.org)

Read more about the event

INRIA Advanced Research Fellowship

dynamicmodelling

Starting from January 2017 and for three years, I will be the recipient of an advanced research fellowship of INRIA (the French Institute for Research in Computer Science and Automation) and work on social modelling at the Institut des Systèmes Complexes Rhône-Alpes.

Read my research project

HDR (Habilitation à Diriger des Recherches)

ControversyMappingTravelCompanion

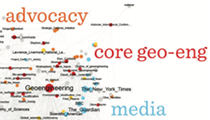
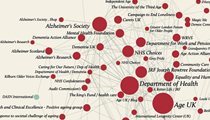
Controversy Mapping, a Travel Companion
HDR in media studies (CNU 71), defended and obtained on 26/09/2016
by Tommaso Venturini (under the Supervision of Pablo Jensen, Ecole Normale Supérieure de Lyon)
Jury: Richard Rogers, Dominique Pestre, Didier Bigo, Eric Fleury, Dominique Vinck

Since my arrival at the médialab of Sciences Po, 6 years ago, my research path has not been straight. Following the projects that I led (EMAPS, MEDEA) and to which I have participated (MACOSPOL, Contropedia, SOURCE, DIME-SHS Web, Politiques de la Terre, AIME…), it has zigzagged through disciplines and traditions and brought me in contact with various epistemic communities, including STS; digital methods; complex network analysis; environmental politics; information design; media studies; natural language processing and more.

In all these encounters, what interested me has been the chance to run experiments, test unusual mixes, try new approaches to the study of collective life. Orthodoxy and faultlessness, I confess, have never been my greatest preoccupations.

Yet, my experiments have not been inconsistent. Traveling far lands, I did not just sightsee. I collected bits and pieces and stitched them together in an ensemble that starts to look (to me at least) more and more coherent. Such coherence, of course, is not straightforward. It is tentative, in progress and, too often, implicit. My HDR thesis provides a much-welcomed occasion to address such coherence explicitly and to do it through a comprehensive account of what Controversy Mapping is to me.

It is CM that brought me to the médialab, it is the course I have been teaching the last 8 years and the approach that supported most of my projects. CM is also a method with a solid tradition and an upward trajectory, increasingly used around the world for teaching and research. Yet, CM still lacks its instruction manual – a text that would distill its unusual brew of STS reflections and digital developments. My HDR thesis is an effort in this direction.

4S-EASST Conference

samenetworks

This year (2016) I intervened at the 4S-EASST Conference with two different presentations:

1. Dr. Jekyll and Mr. Hyde IPCC and the Double Logic of International Expertise
See the slides

2. Actor‐Network Theory VS Network Analysis VS Digital Networks Are We Talking About the Same Networks?
See the slides
Read the paper

Data Journalism at King’s College

DataJournalism

The syllabus of the Data Journalism course that I am teaching with Liliana Bounegru at King’s College London

Download the syllabus

Contrasting medium and genre on Wikipedia to open up Geoengineering

WikipediaGeoengineering

Markusson, Nils, Tommaso Venturini, Andreas Kaltenbrunner, and David Laniado. 2016. “Contrasting Medium and Genre on Wikipedia to Open up Geoengineering.” Big Data & Society 3(2).

An investigation of the place of geoengineering in public debate through the study of networks of Wikipedia pages.

Read the article online

Download the article

DMI Summer School 2016

dancingtogether

Dancing Together: the Fluidification of the Modern Mind

The keynote presentation that I gave at the 2016 edition of the Amsterdam Digital Methods Initiative Summer School. The talk address the question of social modelling and proposed to replace the current ‘spatial approach’ (based on the divide in micro and macro levels) with a natively temporal approach.

See the slides of my presentation

Hyphe, a Curation-Oriented Approach to Web Crawling

Hyphe2

Jacomy, Mathieu; Girard, Paul; Ooghe-Tabanou, Benjamin; Venturini, Tommaso (2016). Hyphe, a Curation-Oriented Approach to Web Crawling for the Social Sciences. International AAAI Conference on Web and Social Media.

A paper and a poster on the functioning of Hyphe, the Web crawler developed by the médialab, and the conceptual principles behind it.

Read the paper online

Download the paper

Download the poster

Data-Sprint: a Public Approach to Digital Research

Datasprint

Venturini, T., Munk, A., & Meunier, A. (2016). Data-Sprint: a Public Approach to Digital Research. (C. Lury, P. Clough, M. Michael, R. Fensham, S. Lammes, A. Last, & E. Uprichard, Eds.) Interdisciplinary Research Methods (forthcoming).

This paper is about the politics of transdisciplinarity. Not in the sense of the research politics fostering collaboration across disciplines, but in the stronger sense of transcending disciplinary boundaries to make significant political contributions. In short: it is about the making research public. Also, this chapter is not theoretical: it discusses the role of social sciences in collective life, but only to introduce (through a concrete example) an original transdisciplinary practice, that we call data-sprinting.

Read the pre-print version of the paper

Narrating Networks: Exploring the Affordances of Networks as Storytelling Devices in Journalism

NarratingNetwork

Bounegru, L., Venturini, T., Gray, J., & Jacomy, M. (2016). Narrating Networks: Exploring the Affordances of Networks as Storytelling Devices in Journalism. Digital Journalism, (forthcoming).

While the mathematical and analytical capabilities of networks have been extensively studied over the years, in this article we argue that the storytelling affordances of networks have been comparatively neglected. In order to address this we use multimodal analysis to examine the stories that networks evoke in a series of journalism articles. We discuss five different kinds of narrative readings of networks illustrated with analyses of examples from journalism.

Read the pre-print version

How to Tell Stories with Networks: Exploring the Narrative Affordances of Graphs with the Iliad

NarratingNetworks

Venturini, T., Bounegru, L., Jacomy, M., & Gray, J. (2016). How to Tell Stories with Networks: Exploring the Narrative Affordances of Graphs with the Iliad. In Datafied Society. Amsterdam: University Press (forthcoming).

The preview of the pre-print version of a chapter for the Datafied Society book that I wrote with Liliana Bounegru, Mathieu Jacomy and Jonathan Gray.

It use the network of the characters of Homer’s Iliad to exemplify six different types of stories that can be told about a graph.

Read the pre-print version

EMAPS wins the Etoiles d’Europe prize

Happy to announce that the project EMAPS has won the prize Etoiles d’Europe celebrating the best EU financed research project.

See Climaps.eu the platform developed by EMAPS.

Read an interview about the prize.

Making climate negotiations public

OpenKnowledgeCOP21

An article presenting the work that I have done with the OpenKnowledgeFoundation on the various versions of the UNFCCC COP21 agreement.

Read the article

Climate Negotiations Browser

ClimateNegotiations

On the eve of the UNFCCC COP21, I am proud to introduce our new platform on climate negotiations,

I have worked for more of one year to this platform with the help of the IISD, the médialab of Sciences Po, the LSIR EPFL and the Atelier Iceberg. The platform allows to browse through the contents of the Earth Negotiations Bulletin and contains two interfaces:
– The discover interface providing a few visualizations on the visibility of actors and issues of the UNFCCC negotiations
The explore interface allowing to ask complex questions such as: “give me all the ENB sections in which AOSIS discuss about Loss and Damage after Warsaw

More info here: http://www.medialab.sciences-po.fr/?p=3477

Contropedia, and the question of analytically separating the medium and the message

ContropediaRoyalAcademy

My presentation of the Contropedia project at the Royal Netherlands Academy of Arts and Sciences, at the occasion of the award of the Erasmus prize to the Wikipedia Community

See the slides of the presentation

See the video of the lecture

O Todo é Sempre Menor que as Partes: um teste digital acerca das mônadas de Gabriel Tarde

ElTodo

Latour, B., Jensen, P., Boullier, D., Grauwin, S., & Venturini, T. (2015). O Todo é Sempre Menor que as Partes: um teste digital acerca das mônadas de Gabriel Tarde. Parágrafo, 2(3).

The Portuguese version of “The Whole is Always Smaller than the Sum of its Part”

Read the article online

Download the pdf

A Tale of Two Cities: Controversy Mapping and Issue Mapping (and any subtle differences)

TwoCities
The presentation I gave at the Digital Methods Initiative Summer School for the launch of the book Issue Mapping for an Ageing Europe by Richard Rogers, Natalia Sanchez and Aleksandra Kil.

See the slides of the presentation

Visual Network Analysis

VisualNetworkAnalysis

Venturini, T., Jacomy, M, De Carvalho Pereira, D. Visual Network Analysis (working paper)

The visualization of networks has so far lacked of reflexivity and formalization. Though all network analysis packages propose rich libraries of visualization functions, most literature on networks analysis is still centered on mathematical metrics and does not detail how to read visualized network. We painfully lack the conceptual tools to think about the projection of graphs in the space.  This paper means to contribute to such reflection and propose a tentative framework for the visual analysis of networks. To do so we will draw on the visual semiotics of Jacques Bertin (1967) and in particular on three of its variables: positions, size and hue. The papers is divided in three sections, each addressing one of the three variables. Each section will explain how to project one variable on networks and provide guidance on how to make sense of the resulting image.

PLEASE BE AWARE THAT THIS IS A WORKING (NON-FINALIZED) PAPER

Download the working paper

Actor-Network VS Network Analysis VS Digital Networks Are We Talking About the Same Networks?

notanetwork

Venturini, T., Munk, A., & Jacomy, M. (2016). Actor-Network VS Network Analysis VS Digital Networks Are We Talking About the Same Networks? In D. Ribes & J. Vertesi (Eds.), DigitalSTS: A Handbook and Fieldguide (forthcoming).

A paper that I wrote with Anders Munk and Mathieu Jacomy for the forthcoming Handbook of Digital STS. It addresses the thorny question of the ambiguity of the word ‘network’

Read the working version of the paper

Scientometrics Landscape

ScientometricsLandscape

A post I published on the blog of the Sciences Po médialab to present the technique of ‘scientometrics landscape’ that we are using to generate maps of the different meanings of CO2 for the ‘Politique de la Terre’ programme.

In the last decades, a humble chemical molecule has become one of the most important actors of modern collective life. Carbon dioxide, or CO2, is increasingly used as a key marker for politics and economics both at the national and international level. The molecule has thus assumed a variety of different meanings according to who use its name. Chemists, biologists, geologists, soil scientists, physicists, climatologists, they all have different CO2 definitions. And their definitions differ from those of the economists, geo-politicians and NGOs and probably even more from the different representations that public opinion may have of the molecule. Instead of trying to average these definitions, we have tried to make these definitions comparable, using advanced techniques in visual scientometrics to disaggregated the CO2 cycle and transform it into a series of ‘CO2 geo-political maps’.

Read the post on the médialab website

See the CO2 scientometrics landscape

Societal Controversies in Wikipedia Articles

contropedia2

Borra, E., Weltevrede, E., Ciuccarelli, P., Kaltenbrunner, A., Laniado, D., Magni, G., … Venturini, T. (2015). Societal Controversies in Wikipedia Articles. In Proceedings of the 33rd Annual ACM Conference on Human Factors in Computing Systems – CHI ’15 (pp. 193–196). doi:10.1145/2702123.2702436

Collaborative content creation inevitably reaches situations where different points of view lead to conflict. We focus on Wikipedia, the free encyclopedia anyone may edit, where disputes about content in controversial articles often reflect larger societal debates. While Wikipedia has a public edit history and discussion section for every article, the substance of these sections is difficult to phantom for Wikipedia users interested in the development of an article and in locating which topics were most controversial. In this paper we present Contropedia, a tool that augments Wikipedia articles and gives insight into the development of controversial topics. Contropedia uses an efficient language agnostic measure based on the edit history that focuses on wiki links to easily identify which topics within a Wikipedia article have been most controversial and when.

Read the paper

Fill in the Gap. A New Alliance for Social and Natural Sciences

SchellingModel

Venturini, T., Jensen, P., & Latour, B. (2015). Fill in the Gap: A New Alliance for Social and Natural Sciences. Journal of Artificial Societies and Social Simulation, 18(2), 11.

In the last few years, electronic media brought a revolution in the traceability of social phenomena. As particles in a bubble chamber, social trajectories leave digital trails that can be analyzed to gain a deeper understanding of collective life. To make sense of these traces a renewed collaboration between social and natural scientists is needed. In this paper, we claim that current research strategies based on micro-macro models are unfit to unfold the complexity of collective existence and that the priority should instead be the development of new formal tools to exploit the richness of digital data.

The paper has scored #1 in the most viewed JASSS articles for over 8 weeks!

Read the paper in the Journal of Artificial Societies and Social Simulations

Download the preprint

Méthodes digitales: Approches quali/quanti des données numériques

reseaux

Venturini, T., Cardon, D., & Cointet, J.-P. (2015). Méthodes digitales: Approches quali/quanti des données numériques – Présentation du numéro spécial. Réseaux, 188, 9. doi:10.3917/res.188.0009

The special issue on digital and quali-quantitative methods that I curated with Jean-Philippe Cointet et Dominique Cardon for the French journal Réseaux.

Day after day new methods appear in the social sciences eroding the classical dichotomy between qualitative and quantitative approaches, circulating between micro and macro, local and global, and allowing researchers to process large amounts of data without sacrificing the thickness of their analysis. These are the experiences gathered in this issue, without exclusion of disciplines, objects or approaches.

Read the introduction to the volume

Read the papers of the special issue

Keynote speech at the Digitale Praxen conference at Frankfurt University

digitalenpraxen

A keynote speech I delivered on 20/02/15 at the ‘Digital Practices’ conference organized by the group “digitization in everyday life” of the German Society of Folklore. In the speech, I discuss four misunderstandings often connected to use of digital traces:
1. Digital traces are not social data
2. Quantity counts less than variety
3. Digital does not mean automatic
4. More quantification demands more qualification
I also try to show than when these misunderstandings are avoided, digital methods can renew the vision of social sciences and help them to overcome the classic divide between qualitative and quantitative methods.

See the video

See the slides

What is a social border? On Continuity and Density in the Social Sciences

border

A conference I gave at the Kings’s College doctoral school with Mathieu Jacomy on the notion of social border and the advantage of adding continuity in social research through digital navigation.

See the slides of the conference

Review of “An Aesthesia of Networks” by Anna Munster

Munster

My review of the excellent book by Anna Muster and networks and their aesthetics.

Read the review

Buy the book


Sciencescape

sciencescape

A tool that I’ve been developing for a few years with Mathieu Jacomy (in fact he has done most of the actual developing). Sciencescape is a great little tool for performing simple scientometrics analysis from Scopus or Web of Science data. The last additions is the module ‘Referenscape’ that allows to extract heterogenous bibliometrics maps based on co-citations.

Use the Scienscape

Watch an how-to video

Escaping the Great Divide

BeyondDivides

A long conference and a workshop that I gave (with Paul Girard) at the University of Coimbra in the framework of the project “The Importance of Being Digital”. The theme of the conference was how digital methods help overcome several classic binary oppositions of traditional social sciences.

See the slides of the conference

See the web page of the workshop

Three Maps and Three Misunderstandings : A Digital Mapping of Climate Diplomacy

MappingClimateNegotiations

Venturini, T., Baya-laffite, N., Cointet, J., Gray, I., Zabban, V., & De Pryck, K. (2014). Three Maps and Three Misunderstandings : A Digital Mapping of Climate Diplomacy. Big Data & Society, 1:1

This article proposes an original analysis of the international debate on climate change through the use of digital methods. Its originality is twofold. First, it examines a corpus of reports covering 18 years of international climate negotiations, a dataset never explored before through digital techniques. Second, in this paper we test an original approach to text analysis that combines automatic extractions and manual selection of the key issue-terms. The originality of our corpus and of our approach encouraged us to question some of the habits of digital research and confront three common misunderstandings about digital methods.

Download the full text 
Read the article online
See the images at hi-resolution

ForceAtlas2, a Continuous Graph Layout Algorithm for Handy Network Visualization

ForceAtlas2

Jacomy, M., Venturini, T., Heyman, S. & Bastian, M. (2014). ForceAtlas2, a Continuous Graph Layout Algorithm for Handy Network Visualization Designed for the Gephi Software. PlosONE, 9:6

Gephi is a network visualization software used in various disciplines (social network analysis, biology, genomics…). One of its key features is the ability to display the spatialization process, aiming at transforming the network into a map, and ForceAtlas2 is its default layout algorithm. We lay out its complete functioning for the users who need a precise understanding of its behaviour, from the formulas to graphic illustration of the result. We propose a benchmark for our compromise between performance and quality. We also explain why we integrated its various features and discuss our design choices.

Download the full text 
Read the article online in PlosONE

La Fabrique de la Loi

FabriqueDeLaLoi

Unfortunately, I have been involved only indirectly in this project (so far). Yet a great example to showcase to illustrate what quali-quantitative methods and digital datascape navigation mean.

See the project website


Climaps by EMAPS, A Global Issue Atlas of Climate Change Adaptation

Climaps

Climaps.eu presents the results of the EU research project EMAPS, as well as its process: an experiment to use computation and visualization to harness the increasing availability of digital data and mobilize it for public debate. To do so, EMAPS gathered a team of social and data scientists, climate experts and information designers. It also reached out beyond the walls of Academia and engaged with the actors of the climate debate.

Climaps.eu is an online atlas providing data, visualizations and commentaries about climate adaptation debate. It contains 33 issue-maps and 5 issue-stories guiding the users in the combined reading of several maps. The atlas is addressed to climate experts (negotiators, NGOs and companies concerned by global warming, journalists…) and to citizens willing to engage with the issues of climate adaptation. It employs advanced digital methods to deploy the complexity of the issues related to climate adaptation and information design to make this complexity legible.

See the Climaps Online Atlas

See the Summary for Policy Maker of the Project on the Social Sciences Research Network

Intangible Cultural Heritage Webs: comparing national networks with digital methods

IntangibleCulturalHeritage

Severo, M., & Venturini, T. (2013). Intangible Cultural Heritage: Webs Comparing national networks with digital methods. New Media and Society, (forthcoming), 1–20. doi:10.1177/1461444814567981

The 2003 Unesco Convention for the safeguarding of the intangible cultural heritage (ICH) is addressed to States and assigns them several tasks. No State, however, can accomplish all these tasks without mobilizing a wide network of institutions, associations and individuals. The national ICH policies intersect, overlap and often transform the existing relationships among these actors. This paper aims at comparing several national networks (France, Italy, Switzerland) involved in the implementation of the 2003 Unesco Convention in order to highlight national trends and specificities. The analysis will employ an innovative methodology based on digital methods and aimed at exploring the landscapes of websites dedicated to the intangible heritage. Analyzing the hyperlinking strategies of ICH actors, we will identify the specific web topology of each nation, showing which actors are central and peripheral, whether clusters or cliques are formed and who plays the roles of authority and hub.

Download the preprint

See the article in the journal website

See the images at hi-resolution

From Before the Cradle: mapping online debates on c-section and family planning

WorldHealthOrganisation

A presentation that I gave at the AFSP (Association Française de Sciences Politiques) congress. The presentation describe and discuss a medium-size example of digital methods research: a digital cartography project on c-section and family planning that the médialab is carrying out for the World Health Organisation in collaboration with Density Design Milan.

See the slides of the presentation

Contropedia (Controversy Mapping in Wikipedia)

Contropedia

Funded by the Network of Excellence in Internet Science (EINS) in the call “Disruptive ideas for an Internet Science”, Contropedia aims to build a platform for the real-time analysis and visualization of controversies in Wikipedia. Controversy metrics will be extracted from the activity streams generated by edits to, and discussions about, individual articles and groups of related articles.
In this project, I coordinate the médialab team and provide advice on the rational of controversy mapping.

See the project website

Watch a video presenting Contropedia

Mapping Connections with Heatmaps

IntangibleCulturalHeritage2

A conference I gave at the Amsterdam Digital Methods Summer School. It presents Heatgraph a new tool of the médialab using the example of the article “Intangible Cultural Heritage Webs: comparing national networks with digital methods”.

See the slides of the conference

Use the tool

Download the preprint of the article

Project SOURCE

source

The aim of the SOURCE project is to establish a virtual centre of excellence is to support, stimulate and coordinate European cross-border and cross-sector research on societal security and to integrate this research in the design and implementation of security measures throughout Europe. The centre will thus form the meeting place for and interface between societal and technological design and innovation, industry, and end-user application. The centre will assemble participants from all levels and segments of security research and implementation across Europe.

In this project, I coordinate the activities of the médialab, which are meant to visualize the results of the research of the other partners and to provide a wide range cartography of the online and scientific discussion on security issues in Europe.

See the description of the deliverables of the médialab

Changing Focal Length

Focale

An introduction to digital methods and their impacts on social sciences.

I have been invited to give this conference at the  Bibliothèque nationale de France during the seminar “Cartographies de l’invisible Art, réseau, big data” (18/04/13)

See the slides of the conference

ASP The Construction of Innovation Networks

ASP

In 2012 and 2013, I have been responsible for organizing the module on Innovation Networks at the the Alta Scuola Politecnica gathering the 150 best students of the Politecnico di Milano and Politecnico di Torino. In a week-long intensive workshop, the students learn about Science and Technology Studies and Digital Methods perform the analysis of an innovation network.

See one of the lessons that I have given at ASP

Des Migrants et des Mots

ClimateMigrants

Venturini, T., Gemenne, F., & Severo, M. (2013). Des Migrants et des Mots. Une analyse numérique des débats médiatiques sur les migrations et l’environnement. Cultures & Conflits, 88(4).

Though environmental degradations appear today as a major driver of migration flows, the debate about the definition of the relationship between environment and migration remains vivid. In public debates, many terms exist to qualify those who have to migrate because of environmental disruptions: this has lead to controversies surrounding the use of these different terms. This article attempts to document this controversy through a study of the different uses of these terms in public debates online.

Download the preprint

Course of Data Journalism

data_journalism

In collaboration with the data journalist Nicolas Kayser-Brill, I have organize one week intensive course of data journalism for the students of the Ecole de Journalisme de Sciences Po.

See the works of my students

The Whole is Always Smaller Than Its Parts

TheWholeIsSmaller

Latour, B., Jensen, P., Venturini, T., Grauwin, S., & Boullier, D. (2012). “The Whole is Always Smaller Than Its Parts” A Digital Test of Gabriel Tarde’s Monads. British Journal of Sociology, 63(4), 591–615.

In this paper we argue that the new availability of digital data sets allows to revisit Gabriel Tarde’s social theory that entirely dispensed
with using notions such as individual or society. By navigating datasets without making the distinction between the level of individual component and that of aggregated structure, it becomes possible to give some credibility to Tarde’s strange notion of ‘monads’.

Download the preprint
Télécharger le preprint en français

Journal of Digital Social Sciences

jodss

Whether scientific communities will benefit from digitalization depends largely on their capability to understand and profit from the dynamics of the web. As long as online journals will remain the mere transposition of their paper counterparts, their interest will be limited to practical advantages. Though important, such advantages are only the smallest part of the revolution that online scientific publishing may yield if it succeeds in harnessing the full potential of digital networks. For digitalization to be a real step forward, innovative forms of digital publishing should be envisioned. This proposal is meant to discuss new forms of scientific publication and to imagine what an online platform for the publishing of digital social sciences may look like.

This conference has been given at the Just-In-Time Sociology workshop (EPFL Lausanne, 04/12/12).

Watch the video of the conference
See the slides of the conference

Visual Network Analysis

VisualNetworkAnalysis

In the last few decades, networks acquired a new set of affordances and reached a larger audience, thanks to the growing availability of tools to design them. Drawn on paper or screen, networks become easier to handle and obtain properties that calculation cannot express. Far from being merely aesthetic, the graphical representation of networks has an intrinsic hermeneutic value. Networks become maps and can be read as such. Yet the visualization of networks has so far lacked of reflexivity and formalization. We designed and read networks as if their visual grammar was obvious, but the more we advance, the more we realize that this is not the case. This conference contributes to such reflection and proposes a tentative framework for the visual analysis of networks.

I have been invited to give this conference as an introductory Paris ThatCamp of Digital Humanities (24/10/12)

See the slides of the Conference
See an example of Visual Network Analysis

Great expectations: méthodes quali-quantitative et analyse des réseaux sociaux

GreatExpectations

Venturini, T. (2012). Great expectations: méthodes quali-quantitative et analyse des réseaux sociaux. In J.-P. Fourmentraux (ed.), L’Ère Post-Media. Humanités digitales et Cultures numériques (pp. 39–51). Hermann: Paris.

This article discusses how digital traces can help social researchers to develop a new generation of quali-quantitative methods. It also introduces the computation, visualization and manipulation affordances of networks as graphs, maps and interfaces.

Download the preprint

Once Upon a Text: an ANT Tale in Text Analysis

anta


Venturini, T., & Guido, D. (2012). Once Upon a Text : an ANT Tale in Text Analysis. Sociologica, 3. doi:10.2383/72700

ANTA or Actor-­‐Network Analyzer is a simple piece of software developed at Sciences Po médialab to offer social researchers a simple text-­‐analysis tool attuned with the theoretical tenets of actor-­‐network theory. Striving to make actor-­‐network theory compatible with modern text-­‐analysis, we have learned much about both. In this paper we’ll discuss our adventure in ANT and text-­‐analysis while describing the basic functions of ANTA and providing examples of its usage.

Download the  pre-print

DIME-SHS Web

web_mapping

In the framework of the ‘equipment d’excellence’ DIME-SHS, I participate as scientific advisor to the development of a series of tools and methods to exploit web traces for the social sciences.

See the project web-page

Why We Love Networks

weLoveNetworks

A conference on the affordances of networks (as graphs, maps and interface) and their potential to exploit digital traces and provide the first example of what quali-quantitative methods for social sciences could be.

I have been invited to give this lecture at the  Ecole de Recherche Graphique de école supérieure des arts à Bruxelles (03/07/12)

Watch the video of the conference at the ERG of Bruxelles
See the slides of the conference

Follow the White Rabbit

FollowTheWhiteRabbit

An introductory controversy linking together controversy mapping and digital methods and explaining why the work well together.

This conference has been given at the Sociology Department of the Copenhagen University (04/03/12)

See the slides of the conference

Welcome to Flatland (Against Emergence)

monads

A conference discussing the concept of ’emergence’ in social sciences and its connection to the methodological distinction between qualitative and quantitative research techniques. In the conference, I argue that digital traceability, providing the possibility to envision a new generation of truly quali-quantitative methods, allows to overcome the opposition between micro-interactions and macro-structures and move toward a ‘flat’ (yet not homogeneous) vision of the social.

I have given this conference at “The Unexpected Conference: do human beings behave as atoms” (CREA Paris, 16/11/11) and at the seminar “Réseaux sociaux : des structures à la politique” (IXXI Lyon, 12/12/11).

See the slides of the conference

EMAPS (Electronic Maps to Assist Public Science)

picture of a melting glacier
What difference does it makes to be equipped with online tools for mapping technoscientific issues? Can such equipment improve the way we publicly discuss science and technology?

To answer such questions, Bruno Latour and I submitted EMAPS to the EU ‘Science in Society’ call.  Focusing on the web as a tool of collective endeavor, EMAPS aims at engaging the actors involved in climate adaptation debate in an ‘open-air’ experiment on the interactive platform developed within the project. Funded by the European Union Commission, the project starts on November first 2011.

Click here to download the project
See the project website

HCI (Hypertext Corpus Initiative)


Venturini, T. (2011).“Hypertext Corpus Initiative, données hypertextuelles pour les sciences sociales”. In e-Dossier de l’audiovisuel Ina (forthcoming).

A short essay presenting the ideas behind the HCI project.

Click here to download the preprint.

The Social Fabric: Digital Traces and Quali-quantitative Methods


Venturini, T. & Latour, B. (2010).“The Social Fabric: Digital Traces and Quali-quantitative Methods”. Proceedings of Future En Seine.

An article I wrote with Bruno Latour on quali-quantitative methods and digital sociology.

Download the preprint here (English)
Version Française

Building on Faults: How to Represent Controversies with Digital Methods

sismograph

Venturini, T. (2012). Building on faults: how to represent controversies with digital methods. Public Understanding of Science, 21(7), 796 – 812. doi:10.1177/0963662510387558.

In this article, I will discuss how to render the complexity of controversiesvthrough an original visualization device: the controversy- website. Capitalizing on the potential of digital technologies, the controversy-website has been developed as a multilayered toolkit to trace and aggregate information on public debates.

Click here to download the preprint.

Sciences Po médialab

medialab

Since its foundation in 2009, I have coordinated the research activities of médialab of Sciences Po.

Created by Bruno Latour, the médialab is a laboratory dedicated to digital research. It is a team of specialists bringing together social scientists, engineers and designers. It is a high- tech facility, a hub for vanguard research, a scientific toolkit and a platform for launching national and international collaborations. The médialab’s project has received an A+ evaluation by the French research evaluation Agency.

See the médialab website